On pinning and isolating CPU cores
Contents
This year I have been involved in running performance benchmarks of Aeron over at Adaptive on two major cloud providers. I learned quite a few things about the arcane arts science craft of running performance benchmarks.
When benchmarking a piece of software, you really want to get the best performance out of it, which is to say that you also want to run it under the best conditions in order to see what is possible. One aspect I’d like to cover in this article is related to giving the program exclusive access to the CPU core(s) it needs to run, without having other threads interfering with the execution. This involves:
- pinning a particular CPU core to a particular process
- isolating one or more CPU cores
CPU pinning ensures that the scheduler of the operating system will always execute a process on the designated CPU core. This is also known as processor affinity.
CPU core isolation ensures that the kernel processes scheduler will not interact with those CPU cores. Normally, the process scheduler may move processes around on CPU cores in order to help provide equal running time to all processes actively executing.
Why do we care?
The main reason for wanting to keep a process running on the same CPU core is to avoid the costs related to thread context switch, which is quite an expensive operation as shown on the last line of the graph below (source):

By default, the operating system’s scheduler will use different policies to decide how to assign CPU cores to threads. On linux, you can see which scheduling policy is applied to a process by running ps -eLfc and checking the CLS row (which stands for scheduling class):
| |
In the sample above, there are 3 different scheduling policies: FF (FIFO), TS (time-sharing) and RR (round-robin). There are a few more in practice, time-sharing being the one that’s used most frequently.
What this means in practice for a thread is that its execution may be paused for some time while it is moved to a different core. This operation takes quite a few CPU cycles as it leads to cache misses for at least the L1 and L2 caches (which are local to a core). And we don’t want that.
Deciding which cores to use
One of the most critical aspects to get right when it comes to pinning and isolating cores is the range of cores to use. To get this right, there are three rules to follow.
Rule 1: never, ever use core 0

Core 0 is the go-to core for the operating system. It’s where the kernel will run core processes (pun not intended) and no matter what you tell it, it will keep doing so. Don’t run your mission-critical, low-latency process on core zero.
Rule 2: avoid core 1

This one was pretty new to me until I read this article on [the] fear of commitment to the first CPU core. And granted, it may sound a bit paranoid to base all future life and death changing core-picking decisions on the incident that happened in this article. That being said, most modern systems have a lot of cores, so skipping core 1 to be on the safe side of things may not hurt.
Rule 3: know the CPU layout

I mean, this is so important that it might as well be rule 1. This being said if you use core 0 you are guaranteed to get abysimal results whereas depending on how badly you screw up rule 3 you may still get to see okay results.
Consider the lstopo output of an Intel Xeon Platinum 8375C CPU @ 2.90GHz CPU. This CPU has 32 cores and since hyperthreading is enabled, it has 64 hyperthreads (reported as Processing Units):
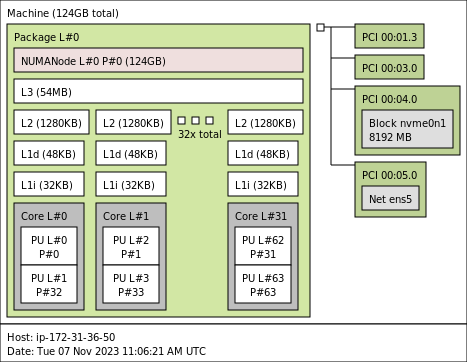
The physical Core L#0 has two Processing Units (PU#0 and PU#1) which are the hyperthreads P#0 and P#32 respectively. It’s important to understand that whilst the operating system will see 64 (logical) cores, if we want to work with the physical core we have to consider both hyperthreads of the physical core.
For example, if your process runs best on one (physical) CPU core, then in this case you’ll want to isolate both of its hyperthreads. Following rule 1 and rule 2, if we wanted to use core L#2 (not shown on the output of lstopo here, but running lscpu -a -e would give the full detail), then we’d need to isolate the logical cores 2 and 34.
Now that we’ve talked about which cores to work with, let’s talk about how to actually pin and isolate them.
Pinning threads to cores with taskset
taskset allows to pin a process to a specific core. There are several ways of using the command. You can specify the core upfront:
| |
This will run the stress -c 1 command (which generates load on a system, in this case on one CPU core) on the third core (it’s a zero-based index). taskset -c 2 is the shorthand of taskset --cpu-list 2 which lets you specify one or more cores rather than having to specify CPU masks, which is rather cumbersome.
It is also possible to move a running process to a specific core:
| |
The latter approach can be seen in action below. Notice in the display of top in the upper right of the screen how the process is started on core 0 and how the CPU usage of the different core changes as we move it around:
Now that we’ve seen how to pin cores to a process, let’s see what we need to do to ensure that said cores aren’t going to be left alone by the operating system scheduler.
Isolating cores
In what follows, we’ll assume that we want to free up 4 physical cores for our processes. On the CPU given as example above, this means that we’ll need to isolate the logical core pairs 2/34, 3/35, 4/36 and 5/37. Expressing this as as CPU list, we want to isolate the ranges 2-5,34-37.
Getting rid of kernel noise
The linux kernel is an amazing and complex piece of software that allows to use the underlying hardware without having to worry too much about what is really happening. What this means is that there’s a lot of maintenance and cleanup work going on constantly in order to keep things running smoothly. Some of the work is shared between CPU cores and some of it needs to run on each core. Looking at this from the perspective of someone wanting to run low-latency, jitter-free processees, this works is noise. If you want to learn more about the details of what exactly is going on I invite you to read this article series on CPU isolation which really goes into the detail of things.
In order to get rid of the noise, we need to set the nohz_full kernel boot parameter:
| |
What this will attempt to do is to keep the housekeeping work away from the specified CPU list, such as:
- stopping the timer tick, an interrupt which usually runs at 100-1000 Hz on each core and performs many small tasks (in practice the tick isn’t stopped entirely, there’s a residual 1Hz tick that remains)
- relocating Read-Copy update callbacks to other cores
- moving unbound kernel workqueues and kthreads to other cores
Note that in order for nohz_full to be able to do its job, the clocksource of the system needs to be a (reliable) TSC (timestamp counter). The TSC is a clock implemented within the processor on x86 architectures. You can set the system to tsc using:
| |
Isolating the cores
We need to make sure that the kernel scheduler won’t schedule any work on the CPUs we want to dedicate to our processes. The preferred way to do this is to use cpusets but there are other techniques as well. Since the context of this article is to create a dedicated environment for benchmarking we’re going to use the isolcpus boot parameter. It is much more rigid than cpusets but for this use-case it will do just fine.
At the core (pun intended), we just need to pass our CPU list via isolcpus like so:
| |
Checking out the kernel documentation though, it is possible to go even further by:
- using the
domainflag to isolate the cores from SMP balancing and scheduling algorithms - using the
managed_irqflag to isolate from being targeted by managed interrupts
So our boot parameters becomes:
| |
Getting rid of hardware IRQs
The affinity of interrupts managed by the kernel has already been changed via the managed_irq flag of isolcpus, but we still have to take care of the other interrupts.
This is possible by setting the affinitiy of the interrupt.
There are several ways of achieving this:
- directly setting the list of allowed cores of each interrupt via
/proc/irq/IRQ#/smp_affinity_list - using irqbalance which takes into account the mask of isolated and adaptive-ticks CPUs on the system when adjusting the affinity to cores
- setting the default IRQ affinity mask using the
irqaffinityboot parameter
Since we’re already heavily relying on kernel boot parameters, let’s use that approach. Our command line becomes:
| |
Note that it is possible to check what irqbalance has done (i.e. to look at the affinities of all IRQs at once) by running:
find /proc/irq/ -name smp_affinity -print -exec cat {} \; | less
After applying the above irqaffinity, this yields the mask ffffffc3,ffffffc3 (for interrupts that support ranges), which is to say everything but cores 2-5.
Testing that it all works
Now that everything is in place, let’s see if it works. We’ll test this both on a physical machine as well as on an AWS c6i.4xlarge instance.
The first thing to do is to verify that CPU isolation is in effect. This can be achieved by looking at /sys/devices/system/cpu/isolated and checking that it returns the configured parameters. If the file is empty, make sure you have applied the boot parameters correctly and that the specified ranges are correct.
Measuring interruptions on an Intel Core i7-7700K CPU @ 4.20GHz
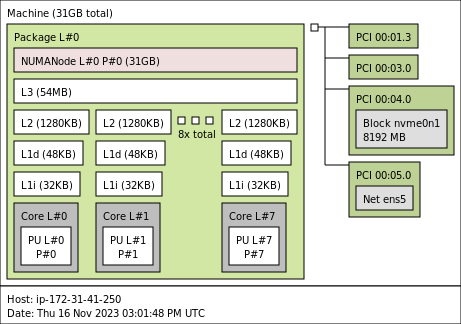
I have an old desktop machine sitting next to me on why I sometimes run experiments. It has 4 cores (2 threads-per cores, so 8 hyperthreads) and the following topology:
Let’s isolate the two last cores. As per the topology, this means we’ll use the following kernel boot parameters:
| |
After applying the boot parameters and restarting the machine, we validate that the isolation settings are in effect:
| |
We’ll be using Erik Rigtorp’s hiccups, which measures jitter introduced by the system. The way it works is described in the documentation:
It runs a thread on each processor core that loops for a fixed interval (by default 5 seconds). Each loop iteration acquires a timestamp and if the difference between the last two successive timestamps exceeds a threshold, the thread is assumed to have been interrupted and the difference is recorded. At the end of the run the number of interruptions, 99th percentile, 99.9th percentile and maximum interruption per processor core is output.
Running hiccups for a minute on the non-isolated cores yields the following:
| |
Whereas on the isolated ones we get the following interruption measurements:
| |
Whilst the amount of hiccups returned by the tool is pretty similar, the p99, p999 and maximum interruption times tell another story entirely.
Measuring interruptions on an AWS c6i.4xlarge instance
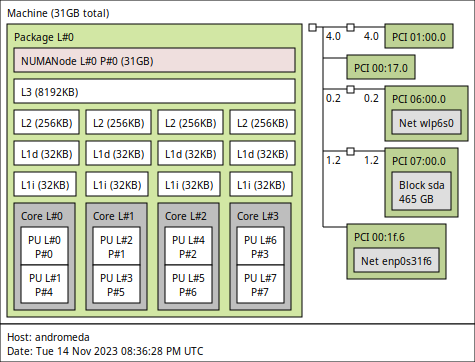
The AWS c6i.4xlarge instance type sports an Intel(R) Xeon(R) Platinum 8375C CPU @ 2.90GHz. When running an instance with hyper-threading disabled (one thread per core), we get the following topology:
Configuring core isolation on this system is arguably simpler than for a system with hyperthreading enabled. When isolating the last 4 cores we use:
| |
However running hiccups when the machine is idle doesn’t seem to have much on an effect:
| |
The effect of core isolation only becomes visible when the machine is under some kind of load. For example, when running stress -c 1 (which will keep core 1 busy), the hiccups measurement returns:
| |
Again, the number of interruptions returned by the tool isn’t very telling but the difference in interruption times (at p99, p999 and max) is.
I’ve been able to reproduce this behavior using other tools and configurations. For example, by using Georg Sauthoff’s osjitter on an AWS c6i.4xlarge with hyperthreading enabled and isolating cores 2-6, we get:
- for an idle instance:
| |
- for the same instance under some load (by running
apache2and having the machine getting single-threaded requests from another instance):
| |
The only metric which this tool reports as constantly low for isolated cores is the amount of involontary context switches (invol_ctx). The difference is interruptions only becomes visible once the system is under some load.
My best guess so far as to why this happens is that it has something to do with the virtualized nature of the instances and I’d be happy if anyone had a more precise explanation of this.
Conclusion
In this article we have looked into what is involved in reducing jitter induced by the operating system on linux systems, which is to say:
- picking the correct cores to dedicate to the task
- configuring the kernel to move away noise (
nohz_full) and interrupts (irqaffinity) from these cores - isolating the cores (
isolcpus)
And remember: don’t use core zero.